
.png)
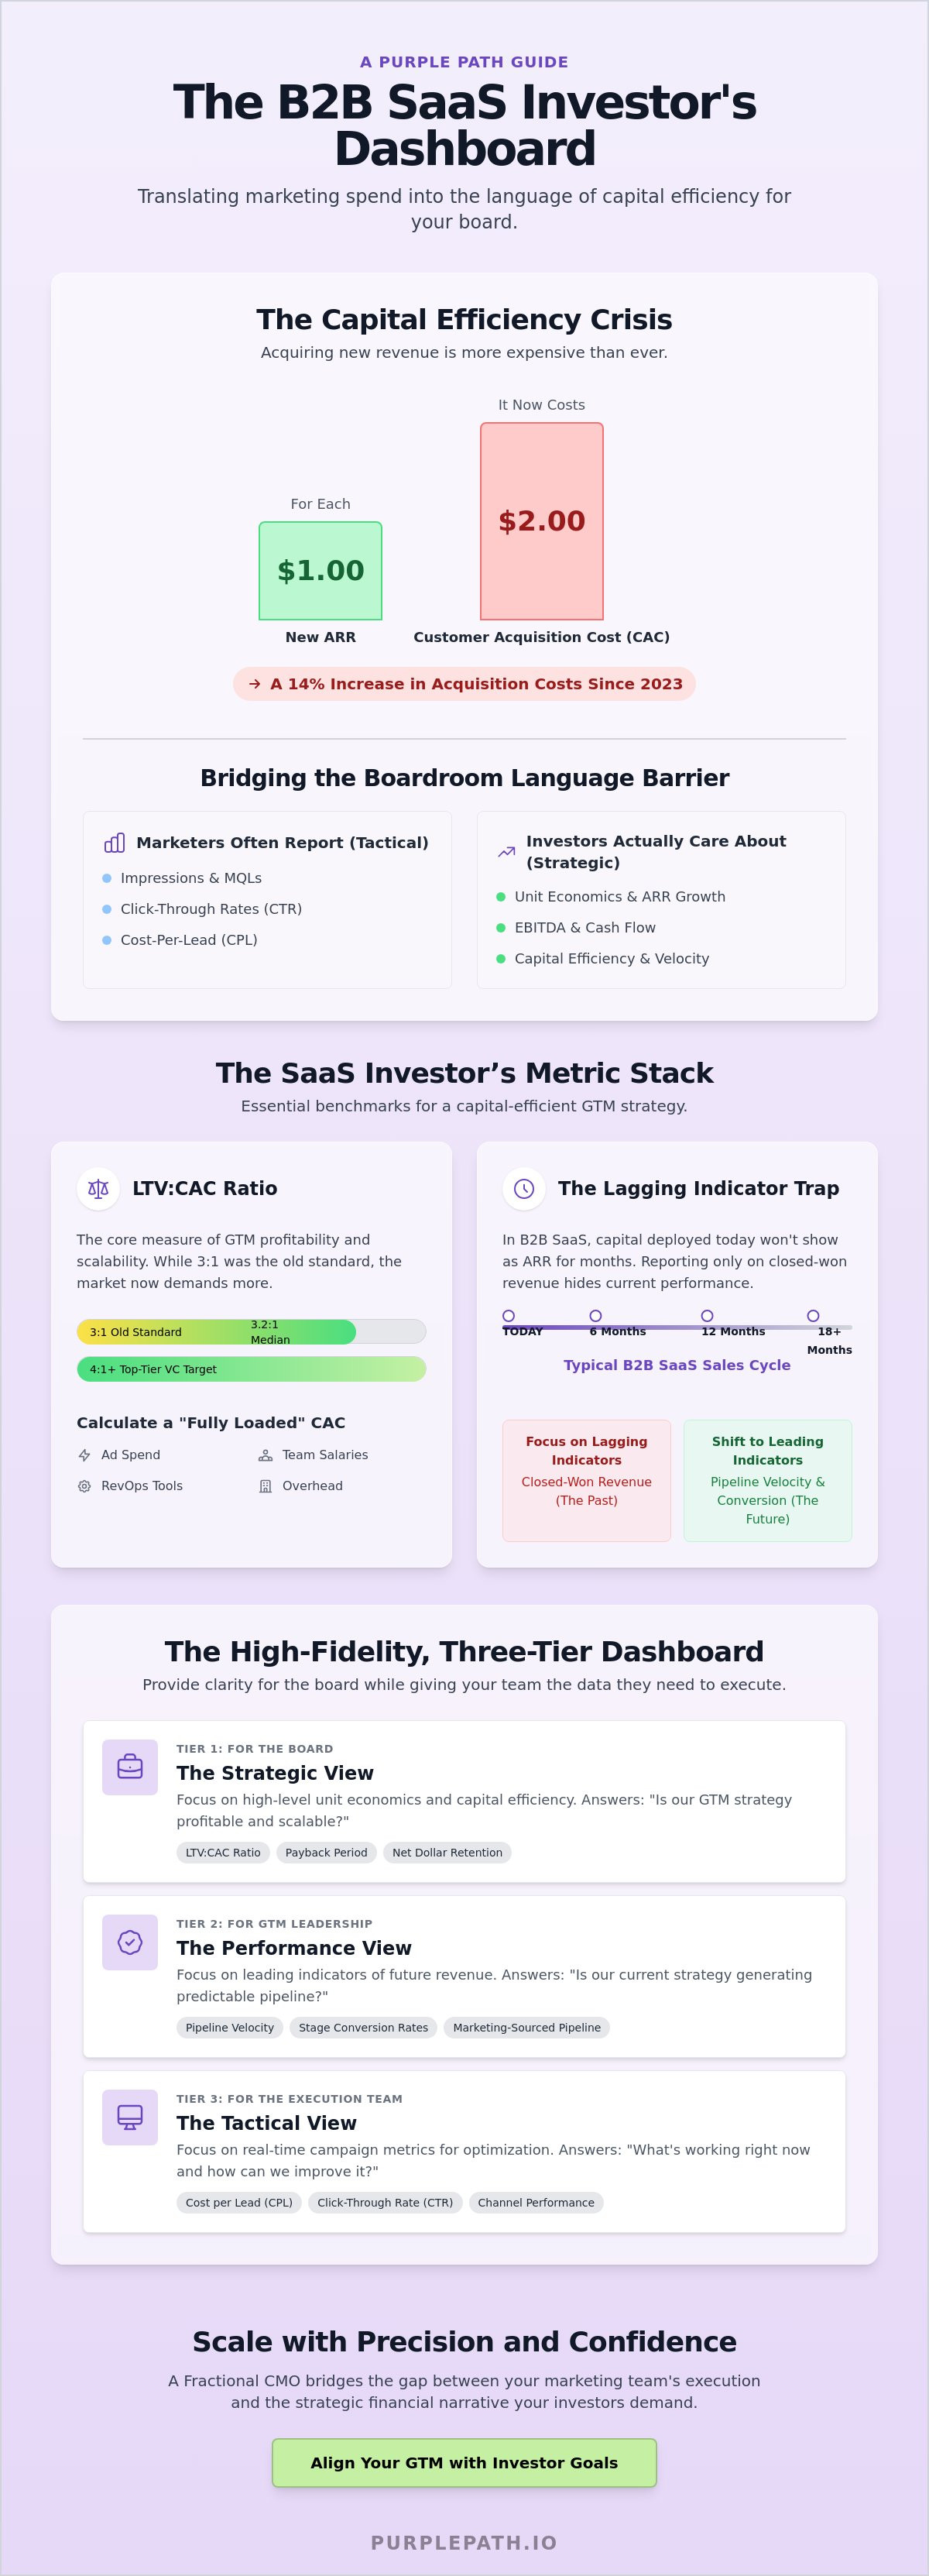
It now costs the median B2B SaaS company $2.00 to acquire just $1.00 of new annual recurring revenue, which is a 14% increase in acquisition costs since 2023. When capital efficiency is the primary lens for growth, measuring marketing ROI for investors becomes less about lead counts and more about rigorous unit economics. You likely feel the pressure when a board meeting turns toward marketing spend, especially if your VCs view those line items as a black hole rather than a strategic lever for ARR.
We believe that defending your budget requires a shift from tactical reporting to high-level strategic alignment. This guide provides the framework to translate your activities into the efficiency metrics your stakeholders actually care about, such as the current median LTV:CAC ratio of 3.2:1. You'll learn how to build a board-ready dashboard and gain the confidence to lead your GTM strategy with data-backed precision. We'll explore how to align marketing with finance to ensure your spend is viewed as a predictable engine for scalable growth. At purple path, we're here to help you navigate this transition and prove the true value of your digital investments.
Campaign-level metrics like click-through rates or cost-per-lead are essential for tactical optimization, but they often function as noise during a board meeting. In the current 2026 market, investors have moved beyond viewing marketing as a simple expense line. They now view it through the lens of capital allocation. When measuring marketing ROI for investors, the goal is to demonstrate that your GTM strategy is a predictable engine for revenue rather than a series of disconnected experiments. While a standard Return on Marketing Investment (ROMI) calculation offers a baseline, it rarely captures the nuances of capital efficiency required by modern VCs.
Traditional marketing reports often focus on the "what" of last month's performance. Investors, however, are focused on the "how much" of next year's growth. With customer acquisition costs rising to a median of $2.00 for every $1.00 of new ARR, the margin for error has vanished. Boards want to see how marketing activities directly influence the company’s long-term valuation and enterprise value. This shift requires a transition from reporting on "spend" to reporting on the velocity of capital recycling.
Most friction in the boardroom stems from a language barrier. Marketers often lead with vanity metrics like impressions or MQLs, while the Board is focused on EBITDA and cash flow. To bridge this gap, marketing leaders must align their output with the goals of the Finance department. This means moving away from lead volume and toward pipeline contribution and unit economics. At purple path, we've seen that the most successful GTM strategies are those where marketing functions as a strategic partner to the CEO, providing clear visibility into how capital is being recycled into growth.
The primary challenge in B2B SaaS is the extended timeline. Since sales cycles can last anywhere from 6 to 18 months, the capital you deploy today won't manifest as ARR until several quarters later. If you only report on closed-won revenue, you're presenting a lagging indicator that doesn't reflect current performance. To satisfy investor curiosity, you must leverage leading indicators like pipeline velocity and stage-to-stage conversion rates. Investor-Grade ROI is a measure of future cash flow predictability. By focusing on these forward-looking metrics, you can defend your budget even when the final revenue hasn't hit the books yet.
Investors evaluate your growth not just by its volume, but by its quality. In a market that prioritizes capital efficiency, measuring marketing ROI for investors requires moving beyond simple lead counts to master the unit economics of the B2B SaaS model. Modern VCs look for evidence that your GTM engine can scale without consuming disproportionate amounts of cash. This means your dashboard must reflect a sophisticated understanding of how every dollar spent translates into long-term enterprise value.
While an LTV:CAC ratio of 3:1 was once the industry standard, current market conditions have shifted the goalposts. Recent data shows the median LTV:CAC ratio for B2B SaaS is 3.2:1; however, top-tier investors often look for ratios of 4:1 or higher to account for market volatility. To provide an accurate picture, you must calculate a "fully loaded" CAC that includes not just ad spend, but also marketing team salaries, overhead, and RevOps tools. Investors often view this relationship as the key metric that matters most to investors because it balances acquisition costs against the long-term health of the customer base.
The speed of capital recycling is equally critical. The median CAC payback period for B2B SaaS currently sits at 8.6 months. If your payback period stretches beyond 12 months, it signals to the board that your marketing spend is tied up too long, hindering your ability to reinvest in new growth initiatives. When presenting these figures, always use Gross Margin LTV rather than pure revenue LTV to show you understand the true profitability of your cohorts.
The SaaS Magic Number offers a high-level view of GTM efficiency by measuring how much net new ARR is generated for every dollar spent on sales and marketing. You calculate this by taking your Net New ARR and dividing it by the GTM spend from the previous quarter. A Magic Number above 1.0 suggests a highly efficient engine where you should consider increasing spend. Conversely, a number below 0.5 indicates that your current strategy needs a structural pivot before more capital is deployed.
Your Burn Multiple provides the final layer of context by showing how much total capital you are "burning" to generate each dollar of net new ARR. With the median CAC rising to $2.00 for every $1.00 of new ARR, a Burn Multiple greater than 2.0 often suggests that marketing and sales are not yet synchronized. Achieving alignment between these functions is essential for maintaining a healthy valuation. If you find these metrics are currently misaligned, a structured GTM Strategy & Execution audit can help identify the bottlenecks in your capital recycling process. By mastering these benchmarks, you move from defending a budget to managing a high-performance investment portfolio at purple path.
Relying on last-click attribution is a dangerous strategy for modern B2B SaaS companies. While it's tempting to credit the final touchpoint, this approach ignores the complex, multi-stakeholder journeys that define today's market. When measuring marketing ROI for investors, you must account for the reality that a buyer might engage with a dozen pieces of content before converting. If you over-allocate budget only to what is easily trackable, you risk starving the very channels that build your brand and feed your pipeline.
Demand Generation is rarely a linear path. Buyers often discover solutions through "Dark Social" channels like private Slack communities, peer recommendations, or podcasts. These touchpoints don't show up in a standard CRM report, yet they are often the primary drivers of high-intent leads. To provide a comprehensive view, your reporting should shift toward a Blended CAC model. This approach combines your total GTM spend across paid, organic, and brand initiatives to show the true cost of growth.
Over-optimizing for granular, trackable channels often leads to a growth plateau. For instance, while PPC campaigns offer a quick break-even period of four months, their ROI is a modest 36%. If you focus exclusively on these metrics, you may overlook the long-term value of top-of-funnel awareness. Many high-growth teams now use self-reported attribution, simply asking customers "how did you hear about us?" to supplement their digital data. Blended metrics provide the truest view of GTM health by aggregating the total cost of acquisition across all channels to reveal the actual efficiency of the entire growth engine.
Organic channels serve as the high-margin foundation that subsidizes your more expensive paid acquisition efforts. Organic search generates 44.6% of all B2B revenue, making it the single largest revenue driver in the digital ecosystem. With an average SEO ROI of 748% in the B2B sector, these long-term investments are essential for lowering your blended CAC over time. At purple path, we help teams balance their portfolio by integrating SEO and AEO/GEO strategy with high-impact thought leadership. This approach ensures that your paid media management isn't doing all the heavy lifting, allowing your capital to work harder and more efficiently for your investors.
Measuring marketing ROI for investors requires more than just a collection of charts. It demands a structured hierarchy that guides the board through a logical narrative of growth. Investors don't want to hunt for ARR in a sea of spreadsheets; they want a clear view of how capital is being recycled into enterprise value. A successful dashboard follows a three-tier structure. The Executive Tier highlights the high-level health metrics: ARR, the LTV:CAC ratio, and Net Revenue Retention, which currently sits at a median of 106% for B2B SaaS. The Strategic Tier examines channel efficiency and pipeline velocity, while the Tactical Tier remains internal for your team to optimize specific campaigns.
Cohort analysis is your most effective tool for demonstrating evolution. By grouping customers by their acquisition date, you can prove that your efficiency is maturing over time. For example, showing that your Q1 2026 cohort has a faster CAC payback period than previous quarters proves that your GTM strategy is becoming more precise. This moves the conversation away from a static snapshot and toward a story of predictable, scalable momentum. We recommend following a 60/40 rule: dedicate 60% of your presentation to hard data and 40% to the human-centric strategic context that explains the numbers.
There will be quarters where ROI appears to dip on paper. This is often the case when you are investing heavily in top-of-funnel awareness or SEO and AEO, which can take 24 to 36 months to deliver peak returns. In these moments, you must use leading indicators like pipeline growth to justify the spend. Explaining the "why" behind the numbers shows that you aren't just reacting to data; you are an architect of long-term growth who understands the delay between investment and ARR realization.
Your dashboard is only as credible as the data supporting it. If your CRM is cluttered with duplicates or inconsistent fields, board-level reports will quickly lose their authority. This is why RevOps and Marketing Operations are the foundation of any investor-ready reporting system. Poor data hygiene is one of the most common marketing strategy challenges that can stall a company’s growth and erode board confidence. To ensure your reporting is bulletproof, our experts at purple path can help you implement a Marketing Operations and RevOps framework that turns your CRM into a single source of truth for every stakeholder.
For Seed to Series B companies, the leap to a full-time, high-salaried CMO often happens too early, leading to an unnecessary spike in the burn multiple without a stable foundation. Startups need executive-level GTM strategy long before they need the overhead of a permanent executive hire. A Fractional CMO provides the strategic depth required for measuring marketing ROI for investors while maintaining a lean, agile operational structure. This role acts as a bridge, translating complex campaign data into the high-level unit economics that board members use to evaluate enterprise value.
Implementing capital efficient Demand Generation programs requires a shift from high-volume lead chasing to high-intent engagement. By focusing on channels with proven long-term returns, such as organic search which drives 44.6% of B2B revenue, we help you build a resilient engine. This methodology ensures that your GTM strategy remains flexible, allowing you to pivot resources toward the highest-performing segments identified in your cohort analysis. At purple path, we align every marketing activity with the specific milestones your investors expect to see before the next funding round.
The cost-benefit of a Fractional CMO is particularly evident during the transition from founder-led sales to a scalable, marketing-led growth model. We handle the heavy lifting of building a predictable pipeline, ensuring that your team stays focused on execution while we manage the strategic roadmap. This collaborative approach ensures that measuring marketing ROI for investors is a transparent, data-backed process. As our team at purple path often emphasizes: "An investor-ready marketing plan is a GTM strategy that views every dollar as a seed for future ARR."
The journey toward board-level confidence begins with a clear-eyed assessment of your current state. Our 90-day GTM audit is designed to find the specific leaks in your pipeline, whether it is a bottleneck in your 13% MQL-to-SQL conversion rate or an imbalance in your paid media spend. This structured methodology allows you to enter your next board meeting with a narrative of precision rather than a list of tactical excuses. You'll gain the data needed to defend your budget and the strategic framework to scale with confidence. To begin this expedition and ensure your marketing spend is fully aligned with your investor's goals, contact the experts at purple path for a GTM strategy session.
Mastering the shift from tactical campaign tracking to strategic unit economics is the defining challenge for modern marketing leaders. By prioritizing benchmarks like the 8.6 month median CAC payback period and adopting a blended attribution model, you transform marketing from an expense into a predictable revenue engine. Measuring marketing ROI for investors isn't just about the math; it's about building a narrative of capital efficiency that inspires board-level confidence. You now have the framework to move beyond vanity metrics and lead with data-backed precision.
At purple path, we bring the expertise of former high-growth SaaS executives to help you navigate this expedition. We've successfully scaled over 50 companies across 10 countries using our specialized B2B SaaS GTM framework. Whether you need to audit your current pipeline or implement a high-fidelity dashboard, we possess the methodology to ensure your growth is both sustainable and scalable. Take the first step toward aligning your marketing strategy with your investor's highest expectations. Book a GTM Strategy Session with purple path and begin your journey toward strategic clarity and commercial success.
A good LTV:CAC ratio for B2B SaaS typically starts at 3:1, though the current median is 3.2:1 according to 2026 benchmarks. Top-tier investors often look for ratios exceeding 4:1 as a sign of high capital efficiency. This higher threshold accounts for potential market volatility and ensures the business remains profitable after accounting for churn and service costs.
Investors calculate Customer Acquisition Cost (CAC) for early-stage startups by dividing the total sales and marketing spend by the number of new customers acquired. This calculation must be fully loaded. It includes advertising spend, software tools, and the salaries of everyone involved in the GTM process. Omitting payroll is a common mistake that leads to an inflated and unrealistic sense of efficiency.
You must include marketing salaries in your ROI calculations to provide an accurate picture of capital efficiency. Investors view marketing as a function of capital allocation, so they need to see the total cost required to generate revenue. Including overhead and payroll ensures that when you are measuring marketing ROI for investors, the data reflects the true operational burden of your growth engine.
The SaaS Magic Number is a formula that divides net new annual recurring revenue (ARR) by the total sales and marketing spend from the previous quarter. VCs track this because it measures the efficiency of your GTM engine. A number above 1.0 indicates that your marketing spend is effectively generating new revenue. A lower number suggests you need to optimize your funnels before increasing spend.
You can prove ROI during long sales cycles by focusing on leading indicators such as pipeline velocity and stage-to-stage conversion rates. Since the median B2B sales cycle can last 6 to 18 months, reporting only on closed-won deals creates a lagging view. Showing growth in high-intent SQLs or pipeline value demonstrates that your current spend is successfully building future ARR.
Both metrics serve different purposes, but Blended CAC is often more important for high-level fundraising as it shows the overall health of the business. Paid CAC is a more granular metric used to determine if specific ad channels are scalable. Investors want to see that your organic channels are subsidizing your paid acquisition to keep the total cost of growth sustainable.
You should provide high-level ROI updates monthly, with a comprehensive deep dive during quarterly board meetings. Monthly reporting allows the team to pivot quickly if a channel underperforms. Quarterly reviews focus on long-term unit economics and cohort analysis. This cadence ensures the board remains aligned with your GTM strategy without getting lost in daily tactical noise.
If your marketing ROI is lower than the industry average, you must contextualize the data by highlighting your current growth phase or specific channel testing. Investors are often comfortable with lower short-term ROI if you can demonstrate that you are investing in long-term assets like content or brand awareness. Use your dashboard to show how you are measuring marketing ROI for investors by identifying specific leaks and presenting a clear plan for optimization.